Weekly Update on Supply and DemandSupply and Demand. It's the most basic principle of economics, and it's also why we've seen home prices in SE Idaho increase significantly in the last few years.
Dated: January 20 2026
Views: 560
Weekly Update on Supply and Demand
Supply and Demand. It's the most basic principle of economics, and it's also why we've seen home prices in SE Idaho increase significantly in the last few years.
---------------------------------------------------------------
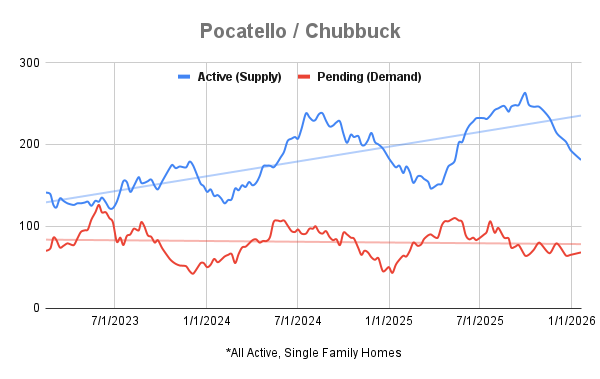
Housing Supply in SE Idaho. When the number of homes for sale decreases, determined buyers have to fight over the few that are left by submitting higher and higher offers. For example, in 2021 we hit a low of 27 single family homes available in the Pocatello/Chubbuck area, and it was a mess. Many homes received multiple offers within the first few days of being listed, and as a result, prices increased sharply. Hopefully we never reach that low of inventory ever again, but we produce this graph and update it weekly to give our clients that exact insight.
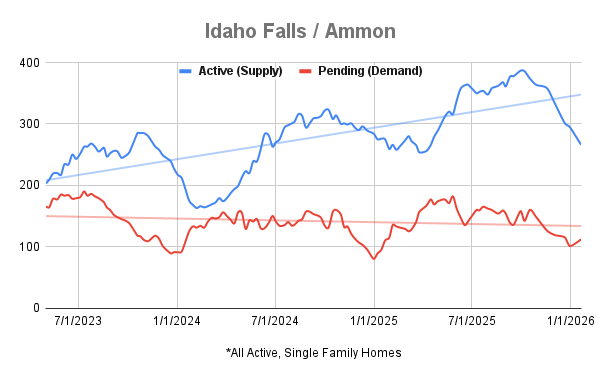
Conversely, as inventory levels rise sellers end up with more competition. This competition is what forces sellers to lower prices and values to decrease.
Today we are currently sitting at 181 homes on the market, down sharply from the high of 263 in September. This is mostly due to the yearly routine of sellers avoiding the winter.
This spring is starting to look a lot like last, where the supply of homes for sale bottoms out in February and starts to pick back up in April and May before Memorial Day Weekend.
Looking forward, we expect that sellers will start to stand their ground on price as we get closer to the end of winter.
--------------------------------------------------------------
Housing Demand in SE Idaho. The other statistic we track on this graph is the current number of properties under contract or what is called pending properties. This is a good indicator of buyer demand and market volume. Again, for reference, in 2020 and 2021 when the market was going crazy, we had an average of 120 - 150 single family homes pending at a time in the Pocatello/Chubbuck area. That is a roaring market for us!
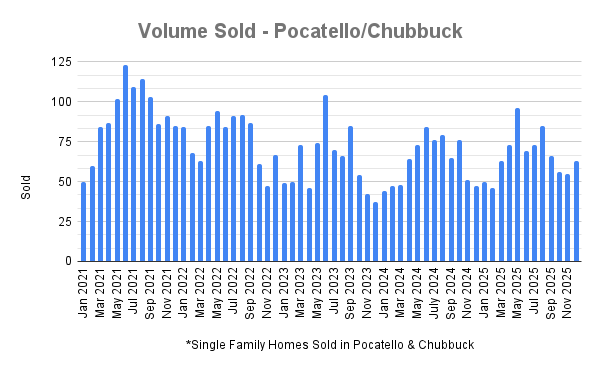
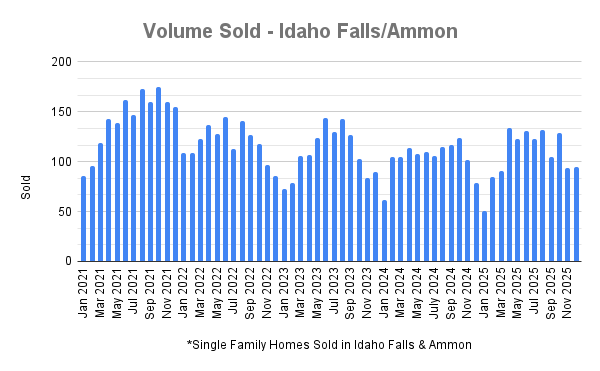
As usual, buyer demand peaked in late May last year and has tappered off through the fall and early winter. Suppressed by the higher interest rates, the total homes sold in 2025 was 899, which is down from our yearly average of 953, and down over 31% from 2020's peak of 1,308 homes that were sold.
In 2025, buyer demand held steady through August and then trailed off as the winter season set in. We expect 2026 to be very similar.
Sold Volume Charts for More Context:
Questions? Comments? Call/text us at (208) 577-0820. We'd love to chat with you about this blog!

As a lifelong resident of Blackfoot and Southeastern Idaho, I bring a deep appreciation for the unique character and charm of this beautiful region. While my early career as a mechanic honed my techni....
Weekly Update on Supply and DemandSupply and Demand. It's the most basic principle of economics, and it's also why we've seen home prices in SE Idaho increase significantly in the last few years.
1. Pre-ApprovalUnless you're paying cash, the first step to your home buying process is obtaining the money you're going to use to pay for it, so contacting a lender and filling out an application
 The data relating to real estate for sale on this web site comes in part from the IDX Program of the Snake River Regional Multiple Listing Service © 2026.
Information provided is deemed reliable but not guaranteed. All properties are subject to prior sale, change or withdrawal. The information being provided is for consumers personal, non-commercial use and may not be used for any purpose other than to identify prospective properties consumers may be interested in purchasing.
This content
last updated on September 26, 2026 9:55 PM UTC
Show More...
The data relating to real estate for sale on this web site comes in part from the IDX Program of the Snake River Regional Multiple Listing Service © 2026.
Information provided is deemed reliable but not guaranteed. All properties are subject to prior sale, change or withdrawal. The information being provided is for consumers personal, non-commercial use and may not be used for any purpose other than to identify prospective properties consumers may be interested in purchasing.
This content
last updated on September 26, 2026 9:55 PM UTC
Show More...
 Greater Pocatello Association of REALTORS® - All information deemed reliable but not guaranteed. All properties are subject to prior sale, change or withdrawal. Neither listing broker(s) or information provider(s) shall be responsible for any typographical errors, misinformation, misprints and shall be held totally harmless. Listing(s) information is provided for consumer's personal, non-commercial use and may not be used for any purpose other than to identify prospective properties consumers may be interested in purchasing. The data relating to real estate for sale on this website comes in part from the Internet Data Exchange program of the Multiple Listing Service. Real estate listings held by brokerage firms other than Wilmot Team may be marked with the Internet Data Exchange logo and detailed information about those properties will include the name of the listing broker(s) when required by the MLS. Copyright ©2026 All rights reserved.
Last Updated: September 26, 2026 10:21 PM UTC
Greater Pocatello Association of REALTORS® - All information deemed reliable but not guaranteed. All properties are subject to prior sale, change or withdrawal. Neither listing broker(s) or information provider(s) shall be responsible for any typographical errors, misinformation, misprints and shall be held totally harmless. Listing(s) information is provided for consumer's personal, non-commercial use and may not be used for any purpose other than to identify prospective properties consumers may be interested in purchasing. The data relating to real estate for sale on this website comes in part from the Internet Data Exchange program of the Multiple Listing Service. Real estate listings held by brokerage firms other than Wilmot Team may be marked with the Internet Data Exchange logo and detailed information about those properties will include the name of the listing broker(s) when required by the MLS. Copyright ©2026 All rights reserved.
Last Updated: September 26, 2026 10:21 PM UTC
